VISUALISING THE DEVELOPMENT PROCESS OF A NEWSCAST
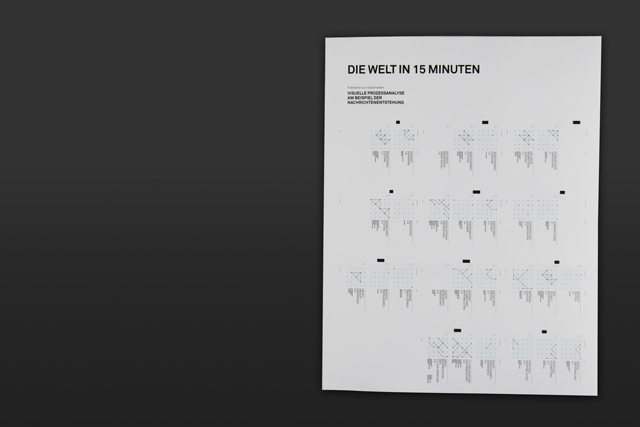
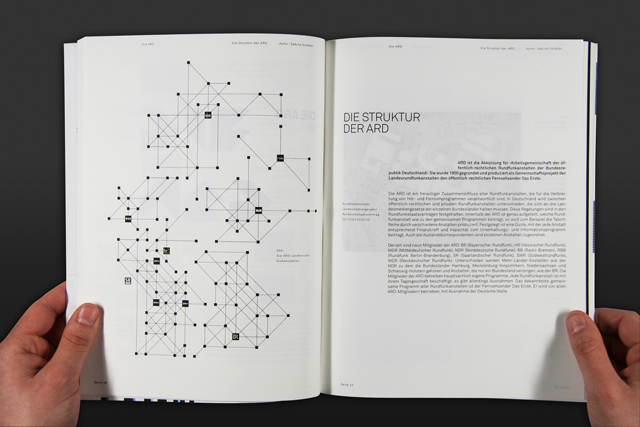
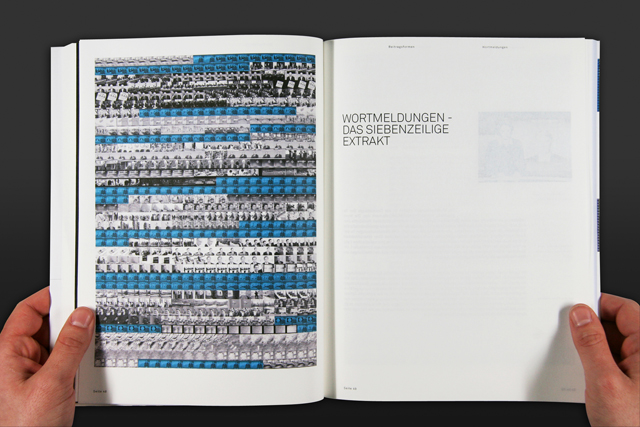
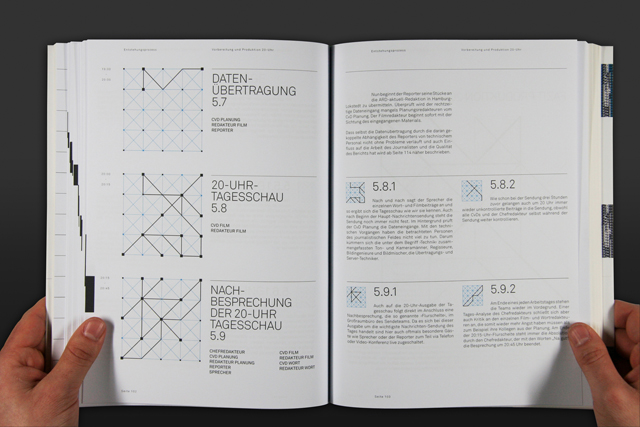
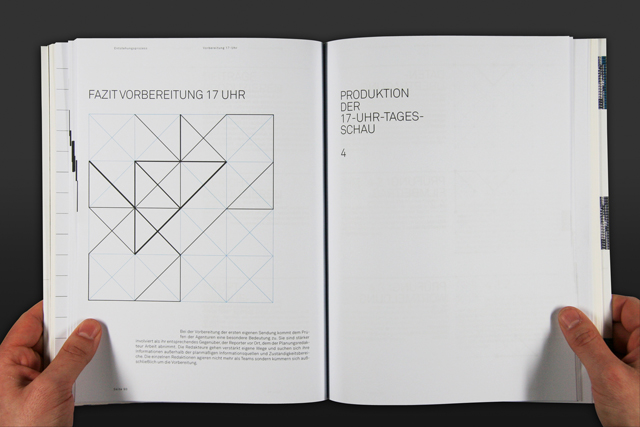
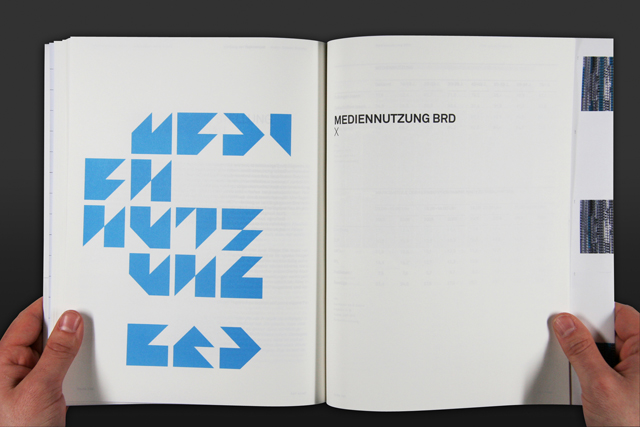
Ron and I developed a visual system by translating real parameters like responsibility, time, command structure, technics, etc. into graphic parameters. Based on a newly created matrix, we generated a huge amount of abstract graphics which are easy to analyse and miscellaneous to use.
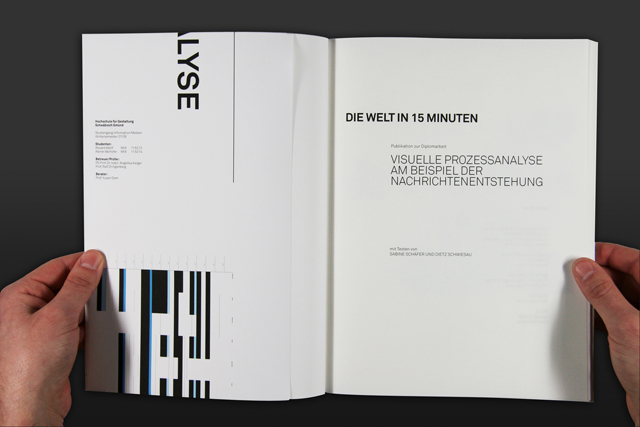
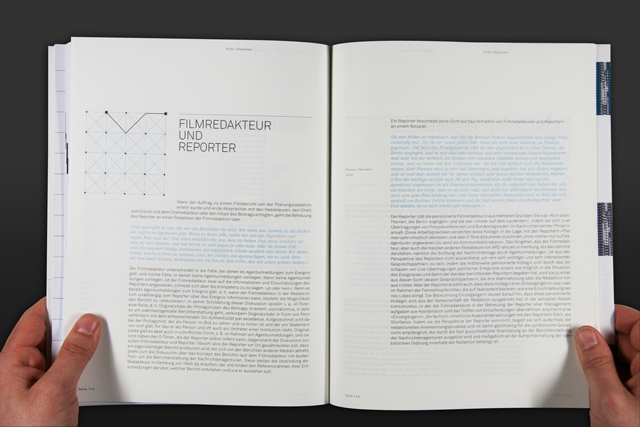
We applied this process analysis tool within our thesis to create and illustrate a book about the development of the Tagesschau, germany's most important newscast. Beside these graphics of the workflow the book contains all the necessary information about the relationships of the editorial staff and the influence each one has on creating the news of our daily dispatch.
–
Employer
HfG Schwäbisch Gmünd
–
Client
Fictious
–
Project Collaborator
Ronald Adolf
–
Project Monitoring
PD Prof. Dr. habil. Angelika Karger
Prof. Ralf Dringenberg
